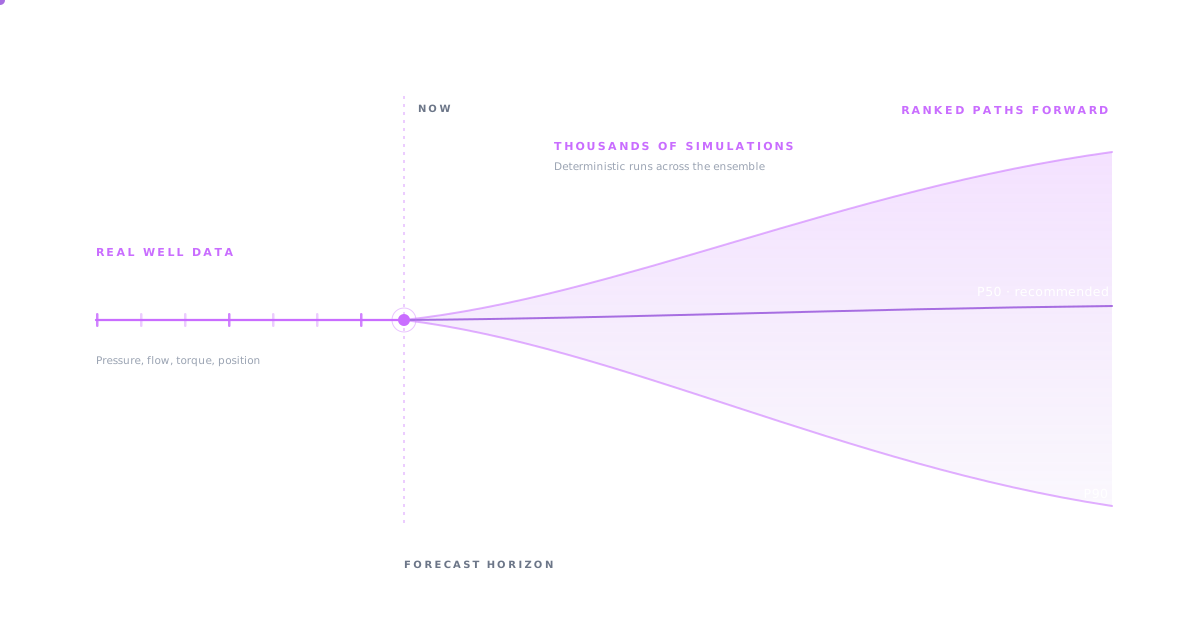
Real Well Data. Thousands of Simulations. Ranked Paths Forward.
RADAR7 structures and validates live well-state data. RuntimePhysics™ executes hundreds or thousands of deterministic scenarios from the same verified state. Runtime Forecast™ delivers ranked, traceable outputs your teams and AI systems can use to evaluate the best-supported operational path.
RADAR7 structures and validates the operational state. DWOS initializes the digital twin. RuntimePhysics™ then executes forward scenarios from the same verified foundation, so every comparison begins with the actual well, not a generic template.
Verified well state initializes the digital twin. Simulation begins from real conditions.
→
STAGE 04
RuntimePhysics™
Continuous execution: what-if scenarios, crew rehearsal, operational decision support
RUNTIME FORECASTTM
From One Live State to Many Defensible Paths
Define the variables and constraints, execute the scenario space through RuntimePhysics™, and convert the outputs into a ranked, traceable dataset for operational evaluation and AI. Runtime Forecast™ supports the decision; it does not hide how the answer was produced.
STAGE 05: VARIABLE DEFINITION
Define What If Parameters
Select the operational variables to test: mud weights, pump rates, casing programs, kill procedures, flow paths, pressure regimes. Define ranges, constraints, and boundary conditions for each variable.
LIVE MODIFICATION
Stage 06: Multi-Study Execution
Run Hundreds or Thousands of Simulations
Each combination of variables generates a distinct simulation, all running from the same verified well state, all governed by the same first-principles physics. Not statistical approximations. Deterministic, physics-bound execution at scale.
RUNTIMEPHYSICSTM AT SCALE
STAGE 07: SYNTHETIC DATA GENERATION
Physics-Grounded Training Data
Every simulation produces high-fidelity data covering scenarios that are rare, expensive, or impossible to capture in the field. Edge cases, failure modes, and extreme conditions, all physically consistent. This is the training and evaluation substrate your AI initiatives need.
AI TRAINING DATA
STAGE 08: BUILT FOR YOUR AI
Feed Your AI Engines
The physics validated dataset is structured for your data science teams and AI models to consume directly. Endeavor provides the deterministic, causally consistent foundation; your AI provides the inference. Every data point is traceable to the simulation parameters that produced it so your models train on physics, not guesswork.
MODEL READY OUTPUT
STAGE 09: OPERATIONAL RANKING
Rank Scenarios on a Foundation You Trust
Run your own optimization, scenario ranking, and decision models against a dataset grounded in first principles physics. Because the inputs are deterministic and conservation true, conclusions are defensible and auditable back to the underlying simulations.
OPERATIONAL ASSURANCE
Stage 10: Continuous Feedback
A Physics Dataset That Improves With Every Well
As operations proceed, real-world data flows back through RADAR7 to keep the digital twin current. Each cycle expands the physics-validated dataset your AI systems learn from a continuously improving Runtime ForecastTM foundation, owned by you, grounded in first-principles physics.
CLOSED LOOP
WHY PHYSICS MATTER
Decision Support Is Only as Strong as Its Physics
Generative models can imitate patterns. Runtime Forecast™ generates scenario data from deterministic physics execution, so edge cases, failure modes, and rare events remain tied to the physical system that produced them.
01
Verified Initial State
Every scenario starts from a structured and validated representation of the actual well, not a generic training template.
02
Deterministic Execution
The same inputs produce the same physics-bound outputs, making the scenario dataset auditable and repeatable.
03
Edge Case Coverage
Rare operational conditions can be generated on demand instead of waiting for unsafe, expensive, or impractical field events.
04
Decision Traceability
Every ranked scenario traces back to the variables, constraints, and simulation run that produced the result.
Capability
RUNTIME FORECAST
PATTERN BASED AI ALONE
Initial State
Real operational data structured through RADAR7.
Depends on historical data quality and availability.
Scenario Generation
Physics-bound simulations across controlled variable ranges.
Pattern completion based on training distribution.
Rare Events
Generated directly from the physics runtime.
Weak where field examples are limited or missing.
Auditability
Traceable to variables, constraints, and simulation outputs.
Often difficult to explain beyond statistical confidence.
APPLICATIONS
Where Runtime ForecastTMChanges the Decision
The value is not a single simulation. The value is testing the operating envelope before the field has to absorb the consequence.
MPD OPERATIONS
Pressure Decision Support
Generate scenario datasets across the pressure envelope to anticipate operational effects before they become field events.
DRILLING
Sequence & Parameter Evaluation
Compare drilling sequences, operating parameters, and system responses against the actual well state before execution.
TRAINING
Actual-Well Rehearsal
Turn every operation into a future training asset by generating realistic scenarios from real well data.
WELL CONTROL
Kill Procedure Evaluation
Test multiple kill methods against the actual well state and compare the consequences before crews execute under pressure.
INTERVENTION
Complex Intervention Planning
Model coiled tubing, wireline, and flow-path scenarios against the actual wellbore before execution.
AI SYSTEMS
Physics-Grounded Model Inputs
Provide AI teams with structured, traceable data from deterministic simulation rather than relying only on historical field records.
RESEARCH FOUNDATIONS
The Science Behind Runtime ForecastTM
Runtime Forecast™ depends on continuous multi-study execution, physics-grounded synthetic data, real-time digital twin state, and long-range fluid behavior. Together, those foundations make scenario outputs traceable, repeatable, and useful for operational decisions.
Tell us what you need to train, test, or de-risk. We’ll focus the conversation on the operation, physics, and deployment environment.
Thanks, your request is in. Our team will follow up shortly.
Something went wrong. Please try again or contact us directly.
Enter through the operation your team already owns.
Runtime Forecast™ begins with a physics-grounded operation. Start in the relevant simulator, preserve the verified state, then execute ranked forward scenarios for operational decisions.